Reading Parameters off an Absolute-Value Graph
Problem
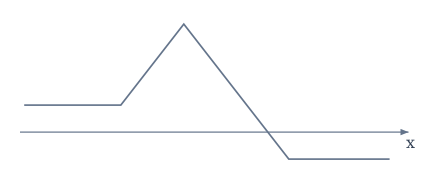
The figure shows the graph of the function
As the graph indicates, is constant at a positive value on the far left, then increases to a maximum, then decreases (crossing the -axis), and is constant at a negative value on the far right.
Determine, with proof, which of the following triples could produce this graph:
1.
2.
3.
4.
Answer
Solution
| Difficulty | 5/10 |
|---|---|
| Topics | functions, Absolute Value, Casework |
Whiteboard
Your sketch is saved only in this browser. To share it, export your drawing as an image (whiteboard menu → Export as → PNG), then upload that image in the comments below.
Discussion
Ask questions, share alternate solutions, and use LaTeX freely.
Log in to join the discussion.
No comments yet.